
In this lab tutorial, we learn about the iodine clock reaction, including its procedure, underlying chemistry, and data analysis.
The Iodine Clock Reaction is a classic chemistry experiment that demonstrates many basic principles of kinetics and redox chemistry. For this, the reaction persists as a staple of general chemistry lab demonstrations.
In this experiment, you prepare two simple, transparent solutions. Once the solutions combine, however, the mixture gradually turns from clear to dark blue to near-black. This color change corresponds to the progress of the reaction, which allows you to visually witness the kinetics in a way that most reactions do not provide.
Interestingly, some chemists colloquially call this reaction the “Egyptian Night” experiment. In Egypt, the darkness of nighttime often arrives rather suddenly, similar to rapid dark color change in this reaction.
To perform the Iodine Clock Reaction, you need an iodine salt, a reductant, an oxidant, an acid, starch, and water as a solvent. As mentioned before, these components become allocated between three different solutions according to these specifications:
Once the solutions mix, the reaction begins.
The most common variant of the Iodine Clock Reaction uses sodium thiosulfate (Na2S2O3) as the reductant and hydrogen peroxide (H2O2) as the oxidant. Potassium iodide (KI) serves as the salt, while sulfuric acid (H2SO4) provides the required acidity. Importantly, gloves, safety goggles, and caution should be observed when using sulfuric acid and hydrogen peroxide to prevent chemical burns.
As we’ll find out in a later section, the kinetics of the reaction depends on the concentrations of acid, iodide, and oxidant. Thus, most lab procedures studying reaction kinetics will vary the concentrations of one or more of these species. Aside from that, the reductant concentration tends to be kept low, as very little is required, while the starch tends to be in excess.
Before the three solutions mix into one, each ionic species dissociates into their respective ions:
During the reaction, K + , Na + , and HSO4 – do not participate, remaining as spectator ions. Once the solutions mix, the hydrogen peroxide oxidizes the iodide into diatomic iodine:
Importantly, as the reaction produces diatomic iodine, the thiosulfate re-reduces the iodine back to iodide:
This back and forth between iodide and iodine continues until all thiosulfate oxidizes away. Afterward, significant quantities of iodide and iodine exist at the same time. They react with one another to form the triiodide ion:
This triiodide ion then forms a complex with the starch. This complex is responsible for the increasing dark blue of the reaction vessel. As a side note, due to the striking dark blue of the complex, a mixture of iodine and iodide called Lugol’s iodine is used to test for trace amounts of starch.

The first reaction, the oxidation, occurs much slower than the reduction, making it the rate-determining step during that first phase of the reaction. Additionally, once the reduction ceases, the oxidation continues to serve as the rate-determining step, as both the formation of the triiodide and the starch complex occur relatively quickly. Thus, for the entirety of the experiment, oxidation determines the progress of the dark blue hue. This is true even though the starch complex is not directly generated from the oxidation.
Aside from the qualitative observation of the increasingly blue reaction vessel, you can periodically measure the starch concentration through spectrophotometry. The resulting data then allows you to quantify the reaction kinetics.
First, you need to do multiple trials of the Iodine Clock with different concentrations of potassium iodide. Then, you quickly place these samples into a spectrophotometer that records concentrations at consistent time intervals. You’d want to set the spectrophotometer to a frequency similar to 600nm to pick up the dark blue of the starch complex.
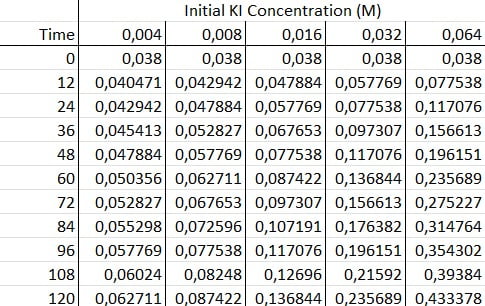
Next, you graph your data. You should find that the absorbance of each graph increases linearly with time. This makes sense since chemical reactions always initially proceed at linear rates.

Finally, to determine the reaction order with respect to KI, you take the logarithms of the initial concentrations and reaction rates and generate a log/log graph.


The slope of the resulting slope corresponds to the reaction order in our rate law, due to the properties of logarithms.
log(RxnRate) = log(k’[KI] n ) = nlog([KI]) + log(k’)
k’: Relative rate constant (s -1 )
n: Reaction Order of KI
The graph then generates a trendline of y = x – 1.2883, indicating that the Iodine Clock Reaction is first order with respect to KI (n = 1).